Recreating DailyBaseballData.com
Intro
Sports analytics has been a subject that I have adopted these past few years. It was actually the movie Money Ball that pushed me into sports analytics. Since then, I have created a few projects involving MLB and College Basketball that are continuously being developed. Sabermetrics has redefined the sports world. Every team has a statistion on their staff now. That would have been a waste of money before 2004.
Besides Money Ball, I love to wager some money on a sports game. Whether is March Madness, The Masters, The Superbowl, The National Championship, etc. Therefore, when I can get an edge from looking at the statistics, I make sure to look at them all.
I have been using DailyBaseballData.com for quite some time now. It is a website that consists of exactly what it sounds like, daily baseball data. I have used the information like ‘Batter vs. Pitcher’ and ‘Stadium Weather Data’ to predict the outcome of MLB games.
However, DailyBaseballData has come to a close after last season. The owner of the site just does not have enough time to maintain the project anymore, which I don’t blame him because it is a big project.
I asked the owner, Dave Hall, if there was any chance that I could help or take over the project. He said that the site “needs a complete rewrite from a data management and production standpoint” and the subscriptions of the services he was using to retrieve his data have since expired.
So here is the start of what Dave suggested.. A full rewrite
What Does The Site Need?
The two things I mainly want to recreate:
- Batter vs. Pitcher
- Who can hit a good pitcher and what pitcher can strikeout a good hitter?
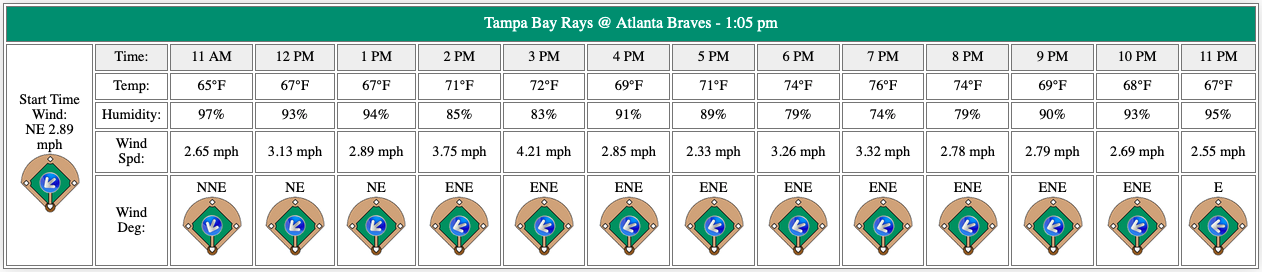
- Weather
- I want to see the temperature, humidity, wind speed & direction
First, lets take a look at DailyBaseballData before it’s gone.
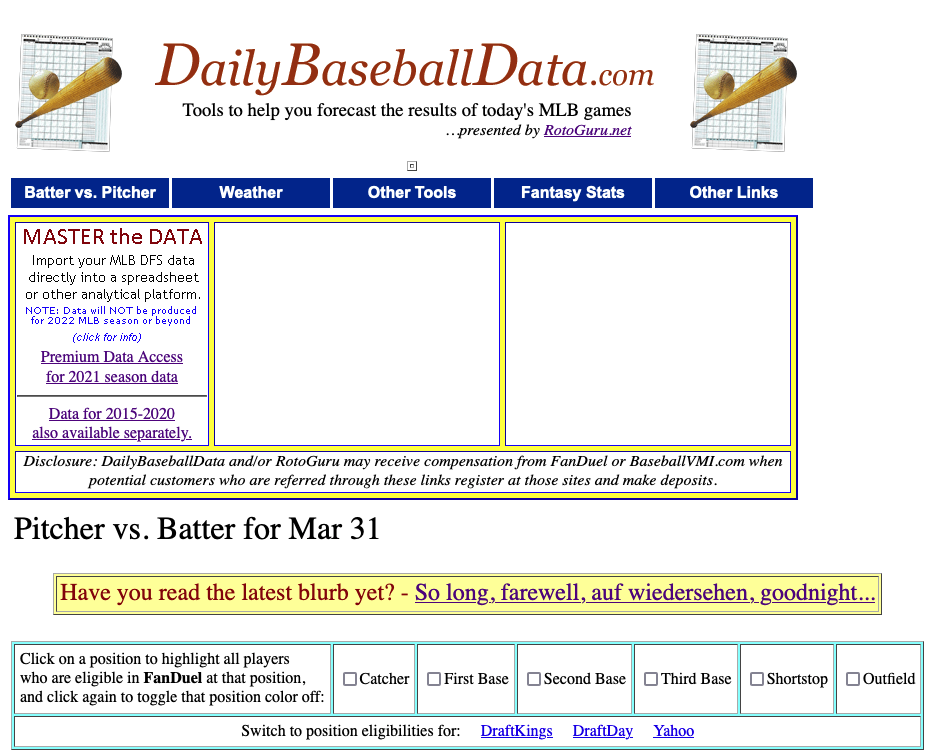
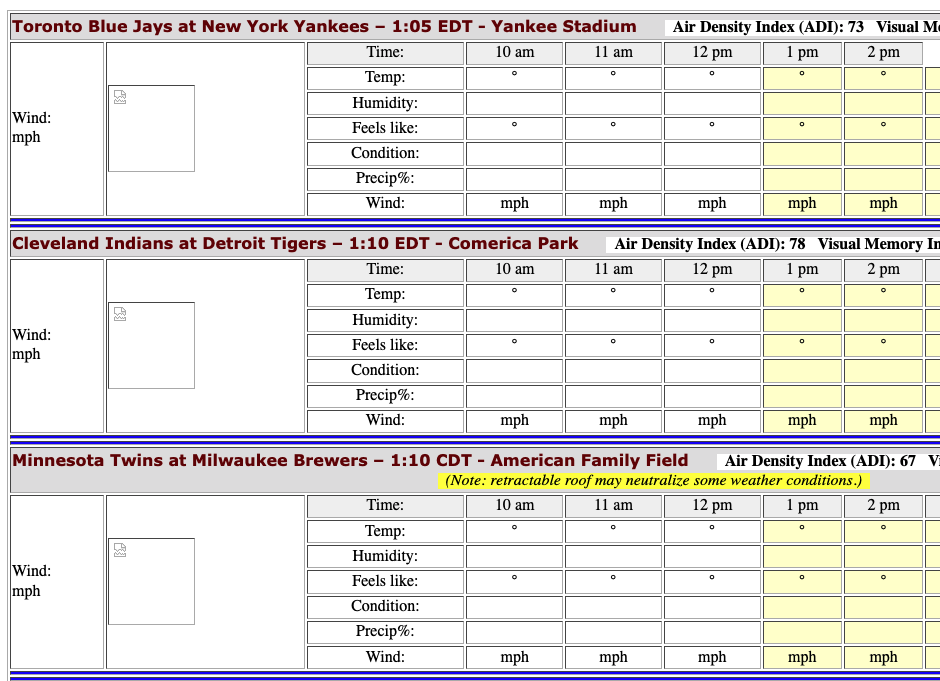
To get a live view, here is an archived version from Aug. 17th 2021
Implementation
Weather
At first, I wanted implement Batter vs. Pitcher since it has a bigger analytical feeling? But the logic for retrieving ever pitcher’s matchup with a batter seems like a tall task.
In the meantime, let’s create the weather feature.
DBBallData had a create visual for the wind direction and speed that I want to recreate first. A while back I actually scrapped all the weather pngs from the site for this project.
They look like this:


It is fairly easy to get weather data for the ballparks. I use openweathermap.com with the latitude and longitude of the ballpark. But the challenge is the orientation of the ballparks.. almost all of them are different. Well, of course they aren’t all facing the same way; however, there is a specific rule in the MLB rulebook for this:
Rule 2.01 - "It is desirable that the line from home base through the pitcher’s plate to second base shall run East-Northeast."
That rule states that every stadium should orient close to how the Miami Marlins’ Ballpark faces. 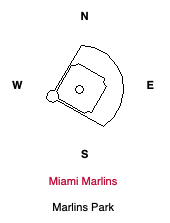 The ballpark orientation will be a problem that I will have to solve in the end.
Here is a list of all MLB ballpark’s latitude and longitude.
To start, I need to get the MLB matchups for the current day. This will be done using the always reliable requests and BeautifulSoup packages from Python. I have scraped plenty from baseball-reference.com as they always have up to date data, and they will usually never block any requests unless you’re greedy with it.
On their homepage, and their ‘Probable Pitchers’ page, they include the matchups for the current day. Using a short script, I scraped the data, cleaned it up, and put it in a Dataframe. From there, I export it to a .csv for whenever I need to use it.
Next, another Python script does the calling to the weather API. I pull the home team from the matchups, grab their latitude and longitude from the Ballparks.json file, and make a request for the hourly weather at that location. This is done for each matchup and output to a JSON file for the PHP files to read.
The easy work is done. Now on to displaying all the data.
I am trying to create this weather page as close as possible to DBBallData’s. Dave had created a simple and informative layout; I don’t need to try to complicate things here.
In the PHP file, I read the JSON file in and loop through it as each table is constructed. This was fairly simple, but I did run into some problems. First, the “Time” variable in the JSON data was being decoded as a 24-hour integer (i.e. 5:00pm = 17). That was causing a lot of the data to be manipulated. It was fixed with the following:
$dt = mktime($item['hour']);
$time = date('g A', $dt);
The big problem with the data was figuring out how to display the correct degree that the wind is blowing across the stadium. I was going to rotate each image respective to the orientation of each ballpark, but that looked awful when displayed.
Eventually, I figured out the math that displays the correct wind degree.
From there, I take that degree and compute the corresponding image.
There is still some more work to do, but here is the result as of now:
Check it out